

Image Details
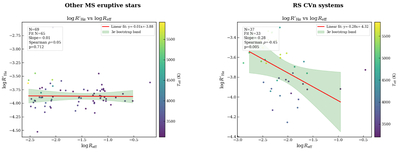
Caption: Figure 13.
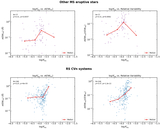
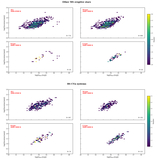
Population-level comparison between the normalized Hα chromospheric activity index and the spot-modulated photometric-variability scale Reff. Other MS eruptive stars and RS CVn systems are shown separately, with individual sources color coded by effective temperature. Red lines show descriptive linear fits and the shaded regions show 3σ bootstrap uncertainty bands. No significant relation is detected for the other MS sample (N = 69, slope = −0.01, ρ = 0.05, p = 0.712), whereas the RS CVn subset shows a statistically significant negative rank correlation (N = 37, slope = −0.28, ρ = −0.45, p = 0.005). Reff is treated as a photometric-variability scale rather than a direct measurement of flare size or starspot radius.
Other Images in This Article
Show More
Copyright and Terms & Conditions
© 2026. The Author(s). Published by the American Astronomical Society.

