

Image Details
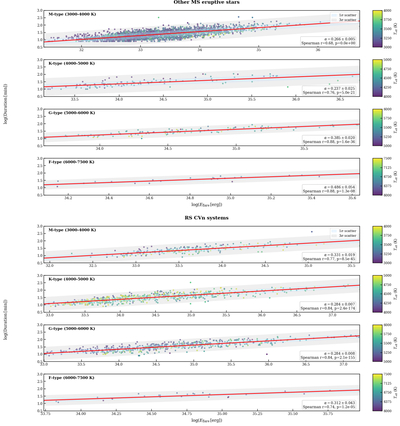
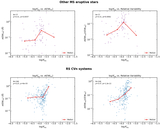
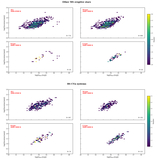
Caption: Figure 9.
Empirical duration–energy relations for TESS flares in other MS eruptive stars and RS CVn systems. The two samples are displayed in separate full-width halves of the figure. Individual flare measurements are color coded by effective temperature. Red lines show the fitted relations in the log (Duration [min])– ﹩\mathrm{log}\left({E}_{\,{\rm{flare}}\,}\right.﹩ [erg]) plane, and the shaded regions show the 1σ and 3σ scatter ranges. The fitted slopes and Spearman statistics are listed in each panel.
Other Images in This Article
Show More
Copyright and Terms & Conditions
© 2026. The Author(s). Published by the American Astronomical Society.

Copyright ©
2026 Astronomy Image Explorer. All Rights Reserved.
