

Image Details
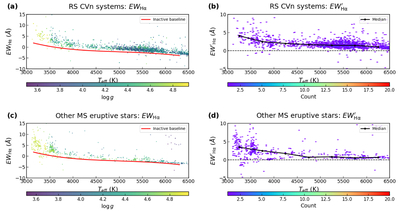
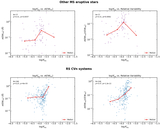
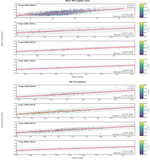
Caption: Figure 1.
Hα equivalent width and excess Hα equivalent width as functions of effective temperature. Panel (a) shows EWHα for RS CVn systems, with points color coded by surface gravity and the red curve indicating the empirical inactive baseline. Panel (b) shows ﹩{\rm{EW}}{{\prime} }_{{\rm{H}}\alpha }﹩ for the same RS CVn sample; color represents the local number of measurements, the black points and line show the binned medians, and the dashed horizontal line marks ﹩{{\rm{EW}}}_{{\rm{H}}\alpha }^{{\prime} }=0﹩. Panel (c) shows EWHα for other MS eruptive stars with the same inactive baseline, and panel (d) shows the corresponding ﹩{\rm{EW}}{{\prime} }_{{\rm{H}}\alpha }﹩ distribution and binned medians. The inactive sequence is constructed at the independent-source level using 100 K bins, a minimum of 10 sources per bin, the 10th percentile below 4000 K, and the 15th percentile at higher temperatures.
Other Images in This Article
Show More
Copyright and Terms & Conditions
© 2026. The Author(s). Published by the American Astronomical Society.

