

Image Details
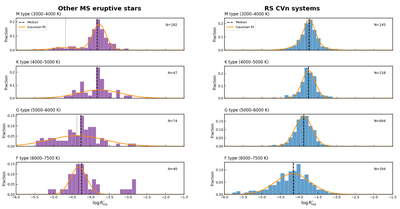
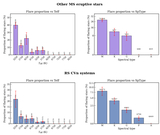
Caption: Figure 2.
Source-level distributions of the normalized Hα chromospheric activity index log R′Hα for other MS eruptive stars and RS CVn systems. The left column shows other MS eruptive stars and the right column shows RS CVn systems in the M-, K-, G-, and F-type temperature intervals. Histograms show the fractional distributions, orange curves provide descriptive Gaussian fits, black dashed lines mark the sample medians, and black dotted lines mark the centers of the fitted Gaussian components. The number of sources is listed in each panel. For targets with multiple LAMOST spectra, a single source-level activity value is calculated from the median Teff and median ﹩{\rm{EW}}{{\prime} }_{{\rm{H}}\alpha }﹩. The RS CVn temperature classes represent the unresolved combined-light systems rather than securely determined primary-star spectral types.
Other Images in This Article
Show More
Copyright and Terms & Conditions
© 2026. The Author(s). Published by the American Astronomical Society.

