

Image Details
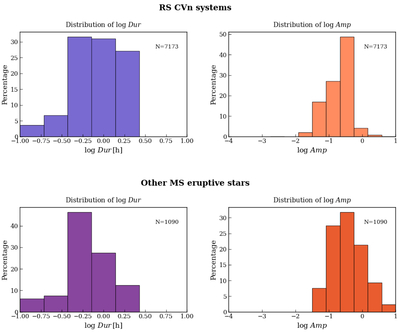
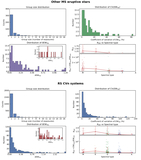
Caption: Figure 7.
Distributions of TESS flare duration and amplitude for RS CVn systems and other main-sequence eruptive stars. The left panels show the distributions of log Dur, where Dur is in hours, and the right panels show the distributions of log Amp. The histograms are normalized to percentage within each subsample.
Other Images in This Article
Show More
Copyright and Terms & Conditions
© 2026. The Author(s). Published by the American Astronomical Society.

Copyright ©
2026 Astronomy Image Explorer. All Rights Reserved.
