

Image Details
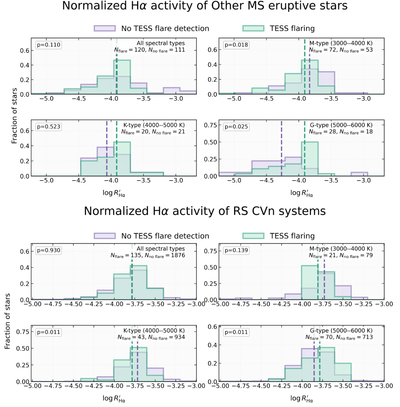
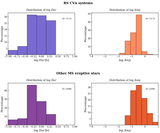
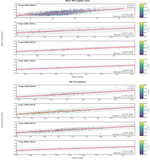
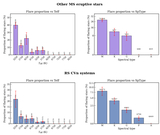
Caption: Figure 3.
Comparison of the source-level ﹩\mathrm{log}R{{\prime} }_{{\rm{H}}\alpha }﹩ distributions for targets with and without TESS flare detections. The top half shows other MS eruptive stars and the bottom half shows RS CVn systems. Purple histograms represent targets with no TESS flare detection, and green histograms represent TESS-flaring targets. Dashed vertical lines mark the corresponding sample medians. The source counts and p-values from two-sided Mann-Whitney U tests are listed in each panel. A nominal threshold of p < 0.05 is used for these exploratory comparisons. Each target contributes one source-level value, preventing multiple LAMOST spectra of the same object from being counted repeatedly.
Other Images in This Article
Show More
Copyright and Terms & Conditions
© 2026. The Author(s). Published by the American Astronomical Society.

