

Image Details
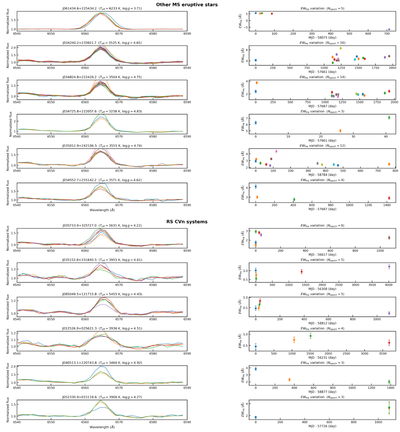
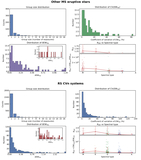
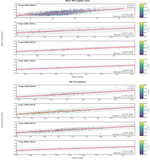
Caption: Figure 6.
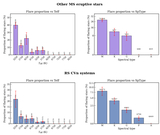
Representative multiepoch Hα spectra and EWHα measurements for eruptive stars with repeated LAMOST observations. Other MS eruptive stars and RS CVn systems are displayed in separate full-width panels to improve readability. For each target, the left panel shows normalized Hα profiles from different LAMOST epochs and the right panel shows the corresponding EWHα measurements as a function of relative MJD. The examples provide visual context for the variability statistics in Figures 4 and 5 and are not intended to represent complete activity cycles.
Other Images in This Article
Show More
Copyright and Terms & Conditions
© 2026. The Author(s). Published by the American Astronomical Society.

Copyright ©
2026 Astronomy Image Explorer. All Rights Reserved.
