

Image Details
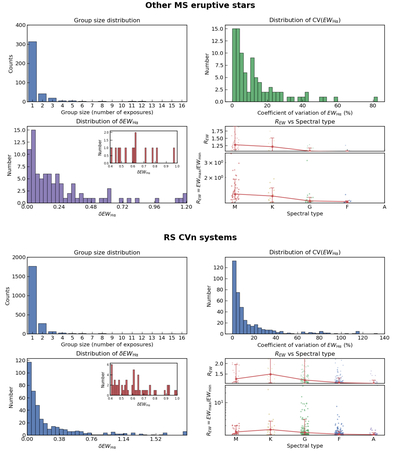
Caption: Figure 4.
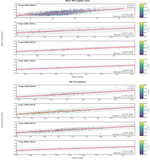
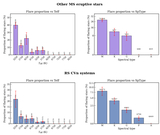
Statistical properties of multiepoch Hα variability for other MS eruptive stars and RS CVn systems. The other MS and RS CVn samples are shown in separate halves of the figure. Each half includes the distribution of the number of LAMOST exposures, the coefficient of variation of EWHα, the normalized peak-to-peak variability amplitude ﹩\delta {{\rm{EW}}}_{{\rm{H}}\alpha }=\frac{{\rm{\max }}\left(| {{\rm{EW}}}_{{\rm{H}}\alpha }| \right)-{\rm{\min }}\left(| {{\rm{EW}}}_{{\rm{H}}\alpha }| \right)}{\,{\rm{median}}\,(| {{\rm{EW}}}_{{\rm{H}}\alpha }| )}﹩, and the maximum-to-minimum ratio ﹩{R}_{\mathrm{EW}}=\tfrac{\max \left(| {\mathrm{EW}}_{{\rm{H}}\alpha }| \right)}{\min \left(| {\mathrm{EW}}_{{\rm{H}}\alpha }| \right)}﹩ as a function of spectral type. The two subclasses are shown separately to evaluate whether the observed variability behavior is affected by RS CVn systems.
Other Images in This Article
Show More
Copyright and Terms & Conditions
© 2026. The Author(s). Published by the American Astronomical Society.

