

Image Details
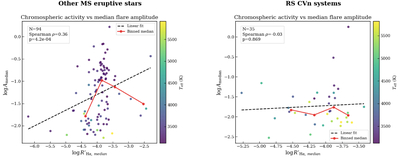
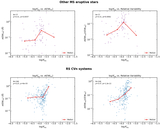
Caption: Figure 12.
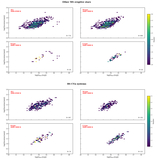
Population-level comparison between the median normalized Hα chromospheric activity index and the median TESS flare amplitude. Other MS eruptive stars and RS CVn systems are shown separately. Individual points represent stars with both LAMOST activity measurements and TESS flare detections and are color coded by effective temperature. Dashed lines show descriptive linear fits, and red connected points show binned medians. The other MS sample shows a statistically significant but scattered positive rank correlation (N = 94, ρ = 0.36, p = 4.2 × 10⁻⁴), whereas the RS CVn sample shows no significant correlation (N = 35, ρ = −0.03, p = 0.869).
Other Images in This Article
Show More
Copyright and Terms & Conditions
© 2026. The Author(s). Published by the American Astronomical Society.

