

Image Details
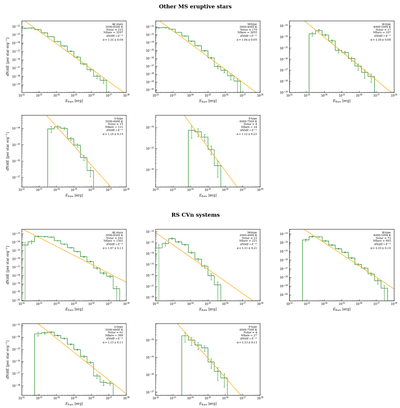
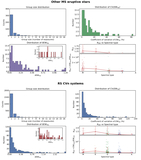
Caption: Figure 11.
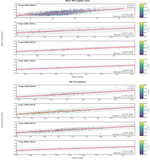
Differential flare-energy frequency distributions for other MS eruptive stars and RS CVn systems observed with TESS. The other MS eruptive stars and RS CVn systems are shown separately. In each half of the figure, the green stepped histograms show the per-star differential distribution dN/dE, normalized per star per unit energy, and the vertical error bars indicate Poisson uncertainties. Orange lines show the best-fitting power-law models of the form ﹩\left(\frac{1}{{N}_{{\rm{star}}\,}}\right)\frac{dN}{dE}=k{E}_{\,{\rm{flare}}}^{-\alpha }﹩. The fitted power-law index α, the number of stars, and the number of detected flares are labeled in each panel. The distributions are normalized per star and are not time normalized by the TESS observing baseline.
Other Images in This Article
Show More
Copyright and Terms & Conditions
© 2026. The Author(s). Published by the American Astronomical Society.

