

Image Details
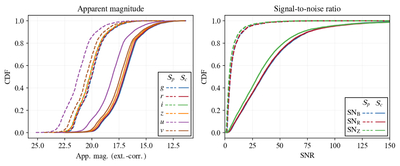
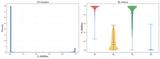
Caption: Figure 9.
Cumulative distribution comparison of apparent magnitudes (left) and signal-to-noise ratios (SNRs) (right) between the clean sample ﹩{{ \mathcal S }}_{c}﹩ (solid lines) and the contaminants ﹩{{ \mathcal S }}_{p}﹩ (dashed lines). Left: extinction-corrected apparent magnitudes in the g, r, i, z, u, and v bands; the magnitude axis is inverted so that brighter sources appear toward the left. Right: SNRs in the B (blue), R (red), and Z (green) channels of DESI. The contaminants are systematically fainter than the clean sample by ∼3 mag across all bands, and their SNRs are consistently concentrated at very low values in all three channels.
Other Images in This Article
Copyright and Terms & Conditions
© 2026. The Author(s). Published by the American Astronomical Society.

