

Image Details
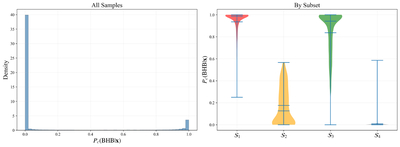
Caption: Figure 4.
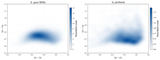
Left panel: histogram of the calibrated posterior probability density Pc(BHB∣x) for all stellar samples. The distribution exhibits a bimodal structure, with the majority of samples concentrated in the low-probability region (Pc(BHB∣x) ≈ 0), reflecting the predominance of non-BHB stars in the data. Approximately 8% of the samples have high posterior probabilities (Pc(BHB∣x) ≈ 1), corresponding to the BHB candidates identified by the clustering method. Right panel: violin plots of the calibrated posterior probability distribution for the four mutually exclusive subsets. Both ﹩{{ \mathcal S }}_{1}﹩ and ﹩{{ \mathcal S }}_{3}﹩ show very high posterior probabilities (median >0.95 for ﹩{{ \mathcal S }}_{1}﹩, median >0.85 for ﹩{{ \mathcal S }}_{3}﹩), whereas the distribution for ﹩{{ \mathcal S }}_{4}﹩ is concentrated in the extremely low-probability range (median nearly 0). The distribution of ﹩{{ \mathcal S }}_{2}﹩ is scattered across relatively low probabilities, reflecting the probability uncertainty caused by inconsistent labels. The vast majority of samples in ﹩{{ \mathcal S }}_{3}﹩ have high posterior probability values, indicating that this subset as a whole is a reliable set of BHB candidates.
Other Images in This Article
Copyright and Terms & Conditions
© 2026. The Author(s). Published by the American Astronomical Society.

