

Image Details
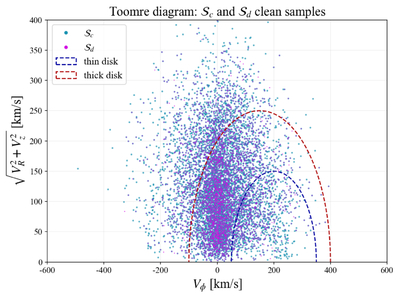
Caption: Figure 5.
Toomre diagram (Vϕ vs. ﹩\sqrt{{V}_{R}^{2}+{V}_{z}^{2}}﹩) of the clean samples ﹩{{ \mathcal S }}_{c}﹩ (blue dots) and ﹩{{ \mathcal S }}_{d}﹩ (magenta dots). The blue and red dashed circles indicate the kinematic boundaries of the thin disk and thick disk, respectively (P. Re Fiorentin et al. 2019).
Other Images in This Article
Copyright and Terms & Conditions
© 2026. The Author(s). Published by the American Astronomical Society.

Copyright ©
2026 Astronomy Image Explorer. All Rights Reserved.
