

Image Details
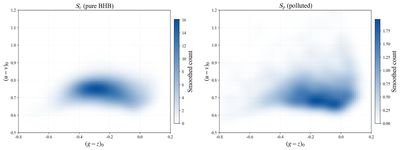
Caption: Figure 8.
Independently normalized smoothed density distributions of ﹩{{ \mathcal S }}_{c}﹩ (left, ﹩| {{ \mathcal S }}_{c}| =7776﹩) and ﹩{{ \mathcal S }}_{p}﹩ (right, ﹩| {{ \mathcal S }}_{p}| =1461﹩) in the (g − z)0–(u − v)0 color space. The contaminants display a strongly asymmetric density profile. While the genuine BHB density contours remain compact and centrally peaked, the contaminant contours are elongated and diluted, with the highest relative density shifting toward the cluster’s boundary in the direction of (g − z)0 reddening and (u − v)0 dispersion.
Other Images in This Article
Copyright and Terms & Conditions
© 2026. The Author(s). Published by the American Astronomical Society.

Copyright ©
2026 Astronomy Image Explorer. All Rights Reserved.
