

Image Details
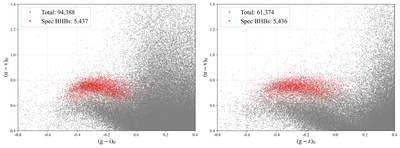
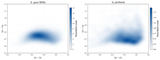
Caption: Figure 1.
Distribution of BHB stars in color space. The left panel shows the distribution in the (g − i)0 vs. (u − v)0 color space, and the right panel shows the distribution in the (g − z)0 vs. (u − v)0 color space. Red dots represent the DESI DR1 spectroscopically confirmed BHB sample from A. Byström et al. (2025). The BHB cluster is more clearly separated from the non-BHB distribution in (g − z)0.
Other Images in This Article
Copyright and Terms & Conditions
© 2026. The Author(s). Published by the American Astronomical Society.

Copyright ©
2026 Astronomy Image Explorer. All Rights Reserved.
