

Image Details
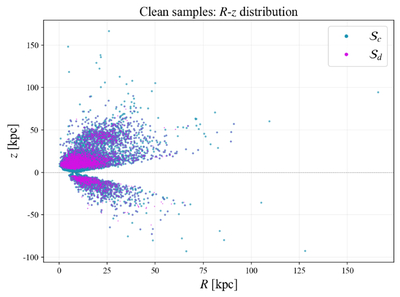
Caption: Figure 7.
Spatial distribution of the clean samples in the Galactocentric cylindrical coordinate system (R, z). ﹩{{ \mathcal S }}_{c}﹩ (blue dots) and ﹩{{ \mathcal S }}_{d}﹩ (magenta dots). The two distributions overlap strongly, with ﹩{{ \mathcal S }}_{c}﹩ extending farther in both the radial and vertical directions, demonstrating the advantage of the photometric method in probing depth.
Other Images in This Article
Copyright and Terms & Conditions
© 2026. The Author(s). Published by the American Astronomical Society.

Copyright ©
2026 Astronomy Image Explorer. All Rights Reserved.
