

Image Details
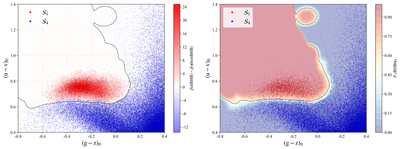
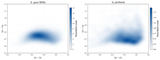
Caption: Figure 3.
Left panel: likelihood density difference, i.e., the difference between the kernel density estimates (KDEs) based on the positive BHB sample (﹩{{ \mathcal S }}_{1}﹩) and the negative non-BHB sample (﹩{{ \mathcal S }}_{4}﹩): ﹩\hat{p}({\boldsymbol{x}}| \,{\rm{BHB}}\,)-\hat{p}({\boldsymbol{x}}| \,{\rm{nonBHB}}\,)﹩. Red regions indicate higher density for positive samples (more likely to be BHB), blue regions indicate higher density for negative samples (more likely to be non-BHB), and the black dashed line marks the zero contour. This panel does not incorporate the prior probability, showing only the likelihood comparison between the two classes in the feature space ((g − z)0, (u − v)0). Right panel: calibrated posterior probability distribution Pc(BHB∣xi), i.e., the probability of each feature point being a BHB star. Colors ranging from blue to red represent probabilities from 0–1, and the black dashed line indicates the 0.5 contour (classification boundary). This panel shows the spatial distribution of the model’s confidence in BHB membership.
Other Images in This Article
Copyright and Terms & Conditions
© 2026. The Author(s). Published by the American Astronomical Society.

