

Image Details
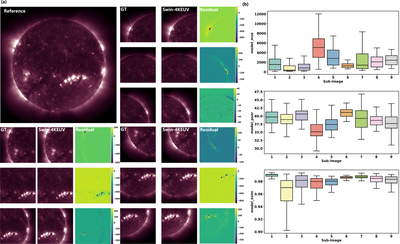
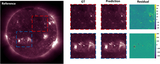
Caption: Figure 5.
Prediction performance evaluated on the original DN scale. (a) Qualitative comparison between the ground truth (GT) and Swin-4KEUI predictions for nine representative subimages. The full-disk reference image is shown on the left, and each subimage presents the GT, model prediction, and residual map. The residual is computed as model output minus GT. The MSE, PSNR, and SSIM values shown below each subimage are calculated after restoring the data to the original DN scale. (b) Boxplot statistics of the average MSE, PSNR, and SSIM for the nine subimages, all evaluated on the original DN scale.
Other Images in This Article
Copyright and Terms & Conditions
© 2026. The Author(s). Published by the American Astronomical Society.

Copyright ©
2026 Astronomy Image Explorer. All Rights Reserved.
