

Image Details
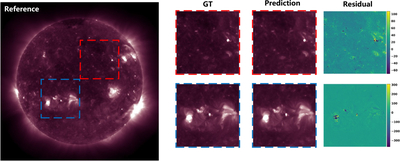
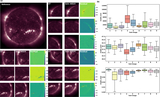
Caption: Figure 8.
Two fixed regions of interest evaluated on the original DN scale. The full-disk reference image is shown on the left, with the red dashed box marking the static region and the blue dashed box marking the active region. The corresponding cropped results are displayed on the right, including the ground truth (GT), model prediction, and residual maps for each region. The residual is computed as prediction minus GT and is shown on the original DN scale.
Other Images in This Article
Copyright and Terms & Conditions
© 2026. The Author(s). Published by the American Astronomical Society.

Copyright ©
2026 Astronomy Image Explorer. All Rights Reserved.
