

Image Details
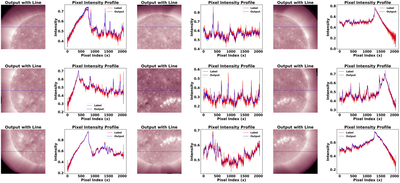
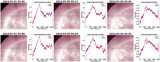
Caption: Figure 3.
Line profiles of the nine subregions. The plots show the results for the first predicted frame (2010 December 28 13:00:01 UT), where the blue curves correspond to the pixel intensities predicted by Swin-4KEUV and the red curves indicate the GT values at the same spatial positions.
Other Images in This Article
Copyright and Terms & Conditions
© 2026. The Author(s). Published by the American Astronomical Society.

Copyright ©
2026 Astronomy Image Explorer. All Rights Reserved.
