

Image Details
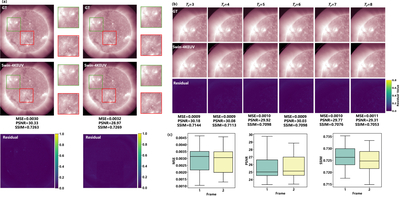
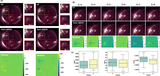
Caption: Figure 4.
Results of image stitching and increased prediction frames. (a) Overall visualization of the stitched full-disk images, displaying two consecutive predicted frames at 04:12 and 04:24 UT on 2010 December 31. (b) Comparison of the first frame’s prediction results after increasing the number of prediction frames. (c) Average PSNR and SSIM metrics evaluated over the complete test set (approximately 22 data pairs from 2010 December 25 to December 31).
Other Images in This Article
Copyright and Terms & Conditions
© 2026. The Author(s). Published by the American Astronomical Society.

Copyright ©
2026 Astronomy Image Explorer. All Rights Reserved.
