

Image Details
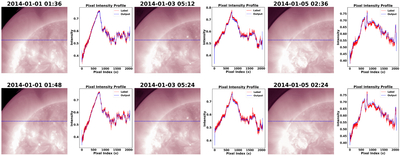
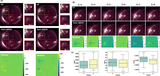
Caption: Figure 7.
Prediction results during the solar maximum (2014). Three representative data pairs are shown, with the top row displaying the first-frame predictions and the bottom row the second frame. The line profiles compare the pixel intensities of Swin-4KEUV (blue) and GT (red) at identical coordinates.
Other Images in This Article
Copyright and Terms & Conditions
© 2026. The Author(s). Published by the American Astronomical Society.

Copyright ©
2026 Astronomy Image Explorer. All Rights Reserved.
