

Image Details
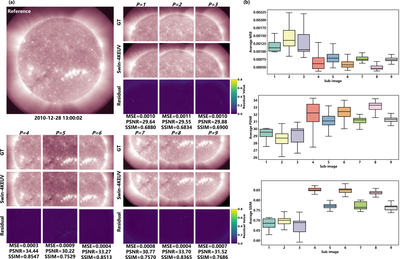
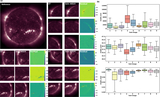
Caption: Figure 2.
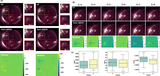
Results of the nine subimages. (a) The first row displays the ground truth (GT), the second row shows the prediction for the first frame (2010 December 28 13:00:01 UT) generated by the proposed Swin-4KEUV model, and the third row illustrates the normalized residuals between the prediction and GT. (b) The average PSNR and SSIM values for each region, evaluated across the entire test set (88 consecutive data pairs from 2010 December 25 to 2010 December 31).
Other Images in This Article
Copyright and Terms & Conditions
© 2026. The Author(s). Published by the American Astronomical Society.

Copyright ©
2026 Astronomy Image Explorer. All Rights Reserved.
