

Image Details
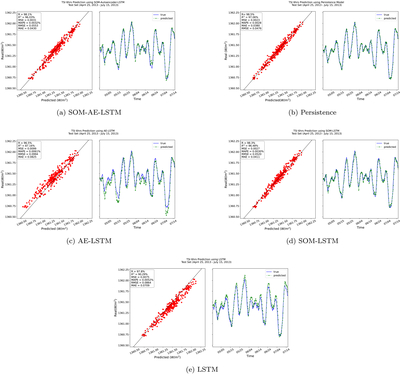
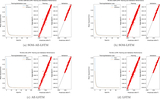
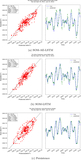
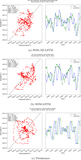
Caption: Figure A1. The 6, 12, 18, 48, 24, and 72 hour training curves
The complete figure set (6 images) is available in the online journal.
Representative 6 hr TSI forecasts over the test period (2013 April 25– July 15): the proposed SOM–AE–LSTM (a), the persistence baseline (b), the AE–LSTM (c), the SOM–LSTM (d), and the LSTM (e).
Other Images in This Article
Show More
Copyright and Terms & Conditions
© 2026. The Author(s). Published by the American Astronomical Society.

Copyright ©
2026 Astronomy Image Explorer. All Rights Reserved.
