

Image Details
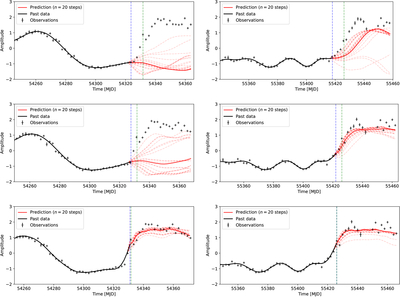
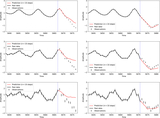
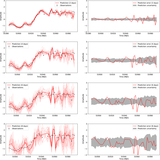
Caption: Figure 9.
Predictions of 4U 1705-44 flux around two transition midpoints. Left column: rapid-rising transition. Right column: slower-rising transition. Top to bottom: past data (black) ending 8, 4, and 0 days before the transition midpoint. Blue vertical lines indicate the end of past data; green vertical lines indicate transition midpoints (moments of largest flux variance within a 20 day window). Red solid curves show nominal predictions; red dashed curves show 20 alternative predictions generated by varying the last flux point, serving as uncertainty indicators. Note that predictions beginning earlier (top rows), where light-curve curvature is large, show greater deviation from true future data than predictions beginning at the transition midpoint (bottom row).
Other Images in This Article
Show More
Copyright and Terms & Conditions
© 2026. The Author(s). Published by the American Astronomical Society.

