

Image Details
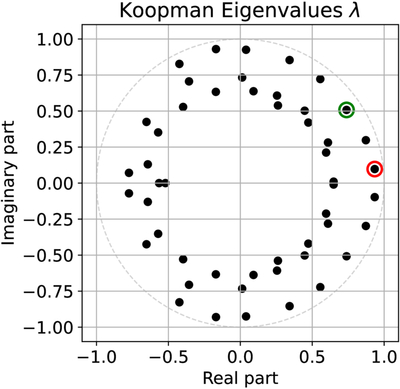
Caption: Figure 7.
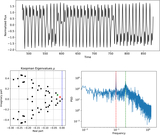
The eigenvalues of the Koopman matrix K of 4U 1705-44 data, calculated with EDMD using a time-delay dictionary specified in Section 3.2 with length d = 50. The x-axis values are the real parts of the eigenvalues, and the y-axis values are the imaginary parts of the eigenvalues. The red circle highlights one of the eigenvalues with a small phase angle θ, and the green circle highlights one of the eigenvalues with a larger phase angle θ.
Other Images in This Article
Show More
Copyright and Terms & Conditions
© 2026. The Author(s). Published by the American Astronomical Society.

Copyright ©
2026 Astronomy Image Explorer. All Rights Reserved.
