

Image Details
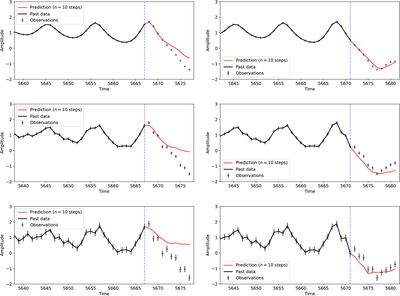
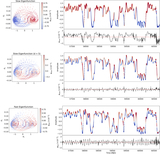
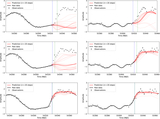
Caption: Figure 5.
(Top panels) The Duffing oscillator time-series data injected with a measurement noise level of σ = 0. The left panel shows the training data (solid black curve) stopped at the blue vertical line before the sharp turning point, and the right panel shows the training data stopped after the sharp turning point. (Middle panels) The Duffing oscillator time-series data injected with a measurement noise level of σ = 0.1. (Bottom panels) The Duffing oscillator time-series data injected with a measurement noise level of σ = 0.2. The red curves show predictions for future time-series data.
Other Images in This Article
Show More
Copyright and Terms & Conditions
© 2026. The Author(s). Published by the American Astronomical Society.

Copyright ©
2026 Astronomy Image Explorer. All Rights Reserved.
