

Image Details
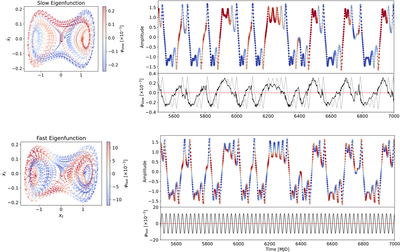
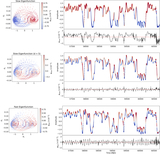
Caption: Figure 2.
Duffing oscillator light-curve test data and phase space colored by eigenfunction amplitude. K was calculated with EDMD using the Fourier dictionary specified in Section 3.2 with m = 2. The phase-space plots (left) show the flux xt against its time derivative ﹩{\dot{x}}_{t}﹩, computed with backward finite differences of the light curve. The lower panel of each group plots the eigenfunction values φ(t), with the dotted red line marking φ = 0. Top: slow-varying mode φslow(t); blue (φslow(t) < 0) and red (φslow(t) > 0) partition the light curve into low-flux and high-flux regimes, respectively. φslow(t) = 0 signifies a transition between regimes. The phase-space plot (left) shows two distinct stable basins labeled by φslow, with low flux (blue) on the left and high flux (red) on the right; long “tails” of opposing color connect the basins, signifying color switching before the system reaches the opposing basin. We additionally overlay the eigenfunction plot (bottom right) with the light-curve flux at each point (in light gray) to demonstrate how sign changes of φslow(t) tend to precede the flux changes visible in the light curve. Bottom: fast-varying mode φfast(t) oscillates rapidly within each oscillation, providing no predictions for slow-varying regime changes. The phase-space plot shows no clear distinction between the left and right basins.
Other Images in This Article
Show More
Copyright and Terms & Conditions
© 2026. The Author(s). Published by the American Astronomical Society.

