

Image Details
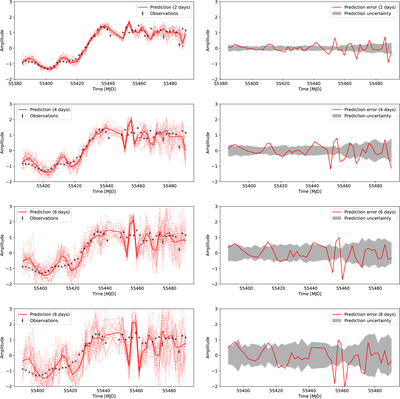
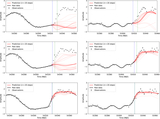
Caption: Figure 10.
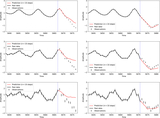
Prediction errors and standard deviations of 4U 1705-44 flux around the transition midpoint on MJD 55430. Left column: various prediction horizons (2, 4, 6, 8 days) represented by the red curves and the observed flux represented by the black points. Red solid curves show nominal predictions; red dashed curves show 20 alternative predictions generated by varying the last flux point, serving as uncertainty indicators. Right column: prediction standard deviations computed from the spread of the red dashed curves in the left panels are represented by the gray bands, and the prediction errors (the differences between the nominal predictions and the real observations) are represented by the red curve. We use 20 trajectories so that individual predictions remain visible in the left panels; standard deviations estimated from 20 realizations are approximate.
Other Images in This Article
Show More
Copyright and Terms & Conditions
© 2026. The Author(s). Published by the American Astronomical Society.

