

Image Details
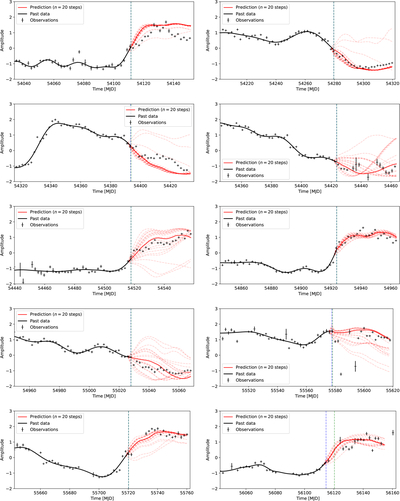
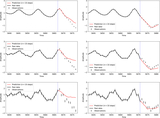
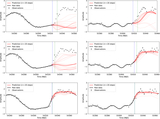
Caption: Figure D2.
Long-term predictions of 4U 1705-44 flux at 10 transition midpoints (MJD 54000–56200). Each panel shows past data (black curve) ending at the blue vertical line, with predictions extending into the future. Red solid curves show nominal predictions; red dashed curves show alternative predictions generated by varying the last flux point, indicating forecast uncertainty. The spread of alternative predictions reflects confidence in the forecast.
Other Images in This Article
Show More
Copyright and Terms & Conditions
© 2026. The Author(s). Published by the American Astronomical Society.

Copyright ©
2026 Astronomy Image Explorer. All Rights Reserved.
