

Image Details
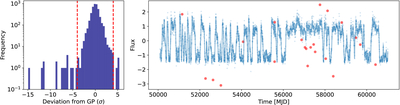
Caption: Figure C2.
Outlier selection and removal for 4U 1705-44. Left: histogram of residuals after the first pass of GP smoothing. We choose the cutoff (red bands) at 4σ, where residuals begin to significantly deviate from the main distribution. Right: rebinned data points overlaid with the initial GP-smoothed light curve. Outlier points are marked in red. Outliers comprise 22 of the 4345 points (0.5%).
Other Images in This Article
Show More
Copyright and Terms & Conditions
© 2026. The Author(s). Published by the American Astronomical Society.

Copyright ©
2026 Astronomy Image Explorer. All Rights Reserved.
