

Image Details
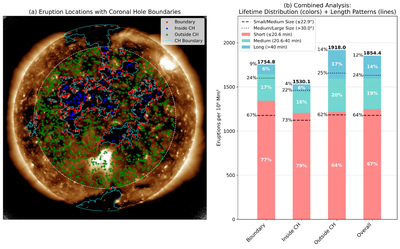
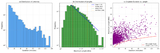
Caption: Figure 9.
Spatial and statistical relationship between minifilament eruptions (MFEs) and coronal hole (CH) boundaries on 2020 June 9. (a) Eruption locations color coded by position relative to CH boundaries, overplotted on an SDO/AIA 193 Å image with CHIMERA-derived CH boundaries (cyan). (b) Combined lifetime (bar colors) and size (dashed/dotted lines) distribution of eruptions in each region. Bars represent lifetime categories: short (≤20.6 minutes, red), medium (20.6–40.0 minutes, teal), and long (>40 minutes, blue). Dashed and dotted lines mark small/medium and medium/large size thresholds, respectively. Numbers and percentages indicate the proportion of eruptions in each class. The analysis shows that CH interiors and boundaries are dominated by smaller, shorter-lived eruptions, while outside CHs host a greater fraction of large, long-lived events.
Other Images in This Article
Copyright and Terms & Conditions
© 2026. The Author(s). Published by the American Astronomical Society.

