

Image Details
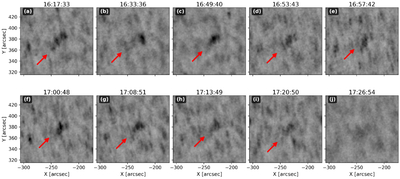
Caption: Figure 7.
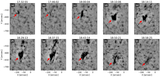
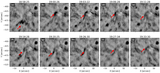
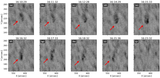
Temporal evolution of an MFE in the northeastern quadrant of the solar disk, tracked from 16:14:29 UT to 17:22:56 UT, spanning about 68 minutes. Red arrows highlight the erupting structure in each selected frame. The feature originated near coordinates (791﹩\mathop{.}\limits^{{\unicode{x02033}}}﹩3, 1393﹩\mathop{.}\limits^{{\unicode{x02033}}}﹩2) and expanded to 26.77 Mm. (The animated version of this figure presents the continuous temporal evolution of the MFE over its full observation period. In the animation, the data is displayed in a side-by-side format: the left panel shows the Hα blue-wing sequence, while the right panel shows the cotemporal Hα line-center sequence. The exact observation time is updated dynamically at the top of the panels. To trace the eruption, a red contour outlines the detected MFE in the blue-wing panel; this identical contour is simultaneously plotted at the exact same spatial coordinates in the line-center panel to validate the corresponding eruptive feature across both datasets).
(An animation of this figure is available in the online article.)
(An animation of this figure is available.)
The video/animation of this figure is available in the online journal.
Other Images in This Article
Copyright and Terms & Conditions
© 2026. The Author(s). Published by the American Astronomical Society.

