

Image Details
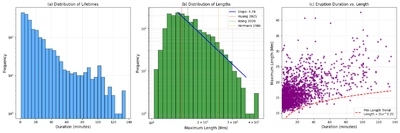
Caption: Figure 8.
Statistical properties of the 1986 MFEs detected in the Hα blue-wing dataset. (a) Histogram of eruption durations (in minutes), plotted on a log scale. Most events are short lived, with a steep drop-off beyond 30 minutes. (b) Histogram of maximum eruption lengths (in Mm) on log–log axes. The solid line represents a single, continuous power-law fit derived using unbinned maximum likelihood estimation (MLE). To strictly isolate the minifilament regime, the fit is bounded between the completeness limit (14.28 Mm) and an upper physical cutoff (36.0 Mm). The distribution follows a steep decay with a scaling index of −4.78, indicating that the probability of occurrence drops rapidly at larger spatial scales. (c) Scatter plot of duration vs. length. A power-law fit to the lower envelope (red dashed line) shows a sublinear trend size ∝ duration0.22, indicating that larger events tend to last longer, but grow more slowly than linearly.
Other Images in This Article
Copyright and Terms & Conditions
© 2026. The Author(s). Published by the American Astronomical Society.

