

Image Details
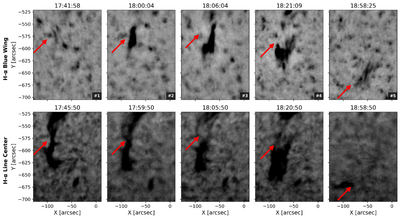
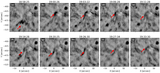
Caption: Figure 2.
Example of the Hα line-center validation process for a Hα blue-wing-detected eruption. The top row shows Hα blue-wing images (taken at a wavelength of Hα − 0.8 Å) with the detected MFE and its evolution through time. The bottom row shows the corresponding Hα line-center image (taken at a wavelength of 6562.8 Å) at the same time. A nearby darkened feature within the matching radius confirms the eruption in both datasets.
Other Images in This Article
Copyright and Terms & Conditions
© 2026. The Author(s). Published by the American Astronomical Society.

Copyright ©
2026 Astronomy Image Explorer. All Rights Reserved.
