

Image Details
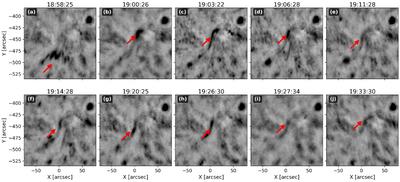
Caption: Figure 5.
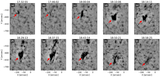
Evolution of a representative MFE observed in the Hα blue-wing images. This event occurred between 18:56:22 UT and 19:57:13 UT, spanning approximately 60.9 minutes. The red arrows indicate the location of the erupting feature in each of the 10 selected frames. The eruption starts as a compact darkening, gradually elongates, and then fades as the material dissipates or lifts off. The filament shows signs of directional motion and partial dissipation over time, suggesting a structured eruptive behavior. (The animated version of this figure presents the continuous temporal evolution of the MFE over its full observation period. In the animation, the data is displayed in a side-by-side format: the left panel shows the Hα blue-wing sequence, while the right panel shows the cotemporal Hα line-center sequence. The exact observation time is updated dynamically at the top of the panels. To trace the eruption, a red contour outlines the detected MFE in the blue-wing panel; this identical contour is simultaneously plotted at the exact same spatial coordinates in the line-center panel to validate the corresponding eruptive feature across both datasets).
(An animation of this figure is available in the online article.)
(An animation of this figure is available.)
The video/animation of this figure is available in the online journal.
Other Images in This Article
Copyright and Terms & Conditions
© 2026. The Author(s). Published by the American Astronomical Society.

