

Image Details
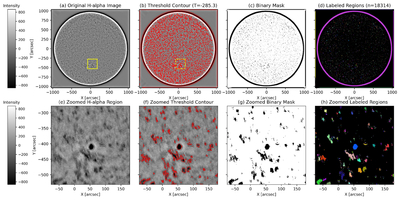
Caption: Figure 1.
The binary masking process for feature detection. (a) Original Hα filtergram showing dynamic solar features, captured on 2020 June 9 at 17:51:05 UT. The yellow rectangle indicates the region magnified in the bottom row. (b) Visualization of the threshold contour (red line) applied to identify features. (c) Binary mask created by applying the threshold value of μ − σ, where μ is the mean intensity and σ is the standard deviation. (d) Labeled mask showing distinct contiguous regions identified as individual features for tracking across successive frames. Different colors are randomly assigned merely to visually distinguish features with different labels from one another. (e)–(h) The same processing sequence as in panels (a)–(d) in the selected region in panel (a), providing detail of individual features.
Other Images in This Article
Copyright and Terms & Conditions
© 2026. The Author(s). Published by the American Astronomical Society.

