

Image Details
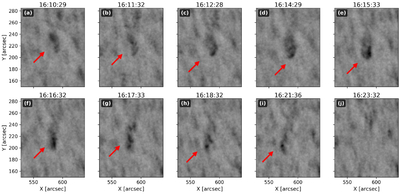
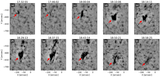
Caption: Figure 6.
Temporal evolution of a short-lived MFE observed in the Hα blue wing. The eruption spans from 16:09:28 UT to 16:18:32 UT, with a total duration of 9.1 minutes and a maximum size of 27.94 Mm. The red arrows mark the location of the feature across 10 selected frames. The filament exhibits rapid growth followed by a sudden disappearance, as can be seen in the final panel, indicating a complete vanishing of the structure. This event highlights the detection method’s ability to capture small-scale, impulsive chromospheric dynamics. (The animated version of this figure presents the continuous temporal evolution of the MFE over its full observation period. In the animation, the data is displayed in a side-by-side format: the left panel shows the Hα blue-wing sequence, while the right panel shows the cotemporal Hα line-center sequence. The exact observation time is updated dynamically at the top of the panels. To trace the eruption, a red contour outlines the detected MFE in the blue-wing panel; this identical contour is simultaneously plotted at the exact same spatial coordinates in the line-center panel to validate the corresponding eruptive feature across both datasets).
(An animation of this figure is available in the online article.)
(An animation of this figure is available.)
The video/animation of this figure is available in the online journal.
Other Images in This Article
Copyright and Terms & Conditions
© 2026. The Author(s). Published by the American Astronomical Society.

