

Image Details
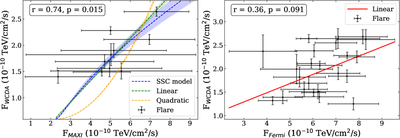
Caption: Figure 17.
Left panel: WCDA VHE gamma-ray flux vs. Maxi X-ray flux. The blue line is the flux relationship derived from SSC scenario with the Klein–Nishina effect considered, and the green and orange lines are the fitted results with linear and quadratic functions, respectively. Right panel: WCDA VHE gamma-ray flux vs. Fermi HE gamma-ray flux. The red line is the fitted result with a linear function. Each point represents the average radiation flux during the outburst period.
Other Images in This Article
Show More
Copyright and Terms & Conditions
© 2026. The Author(s). Published by the American Astronomical Society.

Copyright ©
2026 Astronomy Image Explorer. All Rights Reserved.
