

Image Details
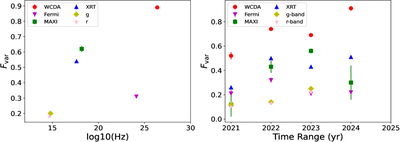
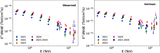
Caption: Figure 5.
Left panel: multi-instrument fractional variability Fvar as a function of the energy over the entire observation period. Right panel: the variation of Fvar in LHAASO-WCDA, with each vertical dashed line representing a time range.
Other Images in This Article
Show More
Copyright and Terms & Conditions
© 2026. The Author(s). Published by the American Astronomical Society.

Copyright ©
2026 Astronomy Image Explorer. All Rights Reserved.
