

Image Details
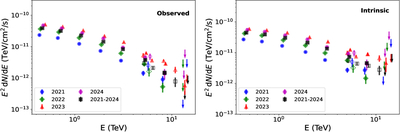
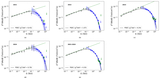
Caption: Figure 7.
The energy spectrum measurement results of LHAASO for Mrk 421. The left figure is the observed energy spectrum, and the right figure is the intrinsic energy spectrum. Among them, the solid points represent the observation results of WCDA, the hollow points represent the observation results of KM2A, and the upper limits are the energy limits given by KM2A. Different colors represent different time intervals.
Other Images in This Article
Show More
Copyright and Terms & Conditions
© 2026. The Author(s). Published by the American Astronomical Society.

Copyright ©
2026 Astronomy Image Explorer. All Rights Reserved.
