

Image Details
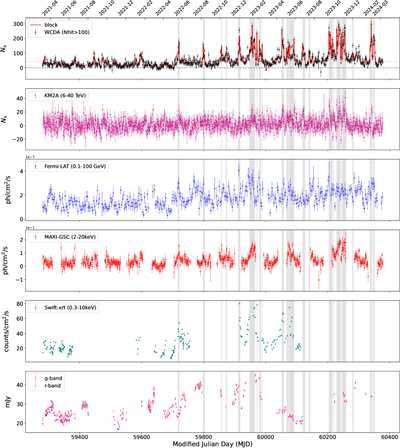
Caption: Figure 2.
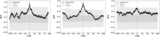
Daily light curves from the Mrk 421 direction in different energy bands from 2021 March 8 to 2024 March 8. The panels from top to bottom refer to LHAASO-WCDA data (Nhit > 100), LHAASO-KM2A data (6–40 TeV), Fermi-LAT data (0.1–100 GeV), MAXI-GSC data (2–20 keV), Swift-XRT data (0.3–10 keV), and optical data. In the top panel, the gray horizontal line represents the zero-flux level, and the pink line indicates the baseline signal (see Section 4.3.1). The red lines show the distinct Ns states identified between change points through Bayesian Block analysis with a 5% false-positive probability, and the gray shaded areas indicate the marked outburst periods.
(The data used to create this figure are available in the online article.)
(The data used to create this figure are available.)
Other Images in This Article
Show More
Copyright and Terms & Conditions
© 2026. The Author(s). Published by the American Astronomical Society.

