

Image Details
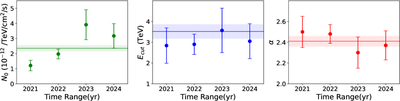
Caption: Figure 8.
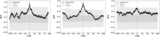
Temporal evolution of the ECPL model parameters, showing from left to right the normalized flux N0, cutoff energy Ecut, and spectral index α. Each solid line represents the best-fit results during the 2021–2024 observation period, with the shaded region indicating the 1σ confidence interval.
Other Images in This Article
Show More
Copyright and Terms & Conditions
© 2026. The Author(s). Published by the American Astronomical Society.

Copyright ©
2026 Astronomy Image Explorer. All Rights Reserved.
