

Image Details
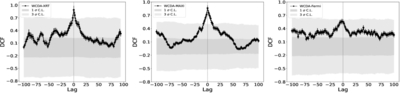
Caption: Figure 6.
The DCF of the LHAASO-WCDA light curve, correlated with the Swift-XRT, MAXI-GSC, and Fermi-LAT light curves. The black error bars represent the uncertainties as derived from R. A. Edelson & J. H. Krolik (1988). The gray area represents the 1σ and 3σ extremes of the DCF distribution of the simulated WCDA light curves when correlated with the measured light curves from the other energy bands.
Other Images in This Article
Show More
Copyright and Terms & Conditions
© 2026. The Author(s). Published by the American Astronomical Society.

Copyright ©
2026 Astronomy Image Explorer. All Rights Reserved.
