

Image Details
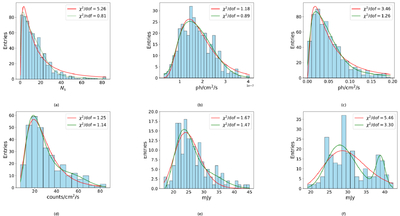
Caption: Figure 4.
Histograms of the MWL fluxes are shown, with (a) to (f) representing the distribution and model fits for LHAASO-KM2A, Fermi-LAT, MAXI-GSC, Swift-XRT, ZTF (g band), and ZTF (r band), respectively. In each plot, the red line indicates the lognormal fit, the blue line indicates the Gaussian fit, and the green line represents the combined Gaussian and lognormal fit.
Other Images in This Article
Show More
Copyright and Terms & Conditions
© 2026. The Author(s). Published by the American Astronomical Society.

Copyright ©
2026 Astronomy Image Explorer. All Rights Reserved.
