Image Details
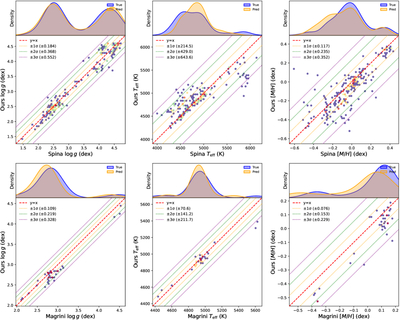
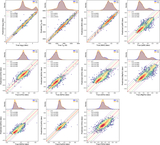
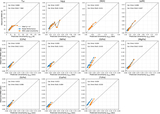
Caption: Figure 13.
Cross-survey validation of fundamental parameters. Top panels: comparison against the GALAH survey (L. Spina et al. 2022) for 280 common stars. Bottom panels: comparison against the GES (L. Magrini et al. 2017) for 37 common stars. The red dashed line indicates the identity relation (y = x). The dotted lines represent the ±1σ, ±2σ, and ±3σ dispersion intervals. The top marginal panels show the probability density distributions of the optical surveys (blue) and ours (orange).
Other Images in This Article
Show More
Copyright and Terms & Conditions
© 2026. The Author(s). Published by the American Astronomical Society.
Copyright ©
2026 Astronomy Image Explorer. All Rights Reserved.