Image Details
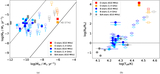
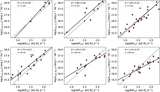
Caption: Figure 5.
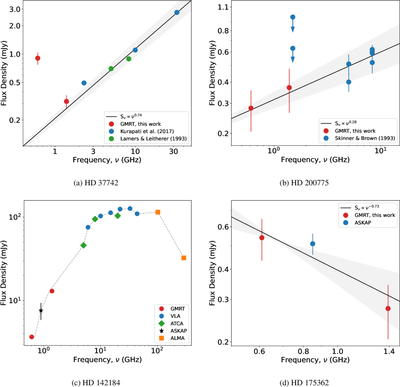
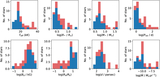
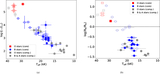
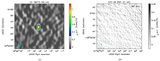
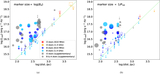
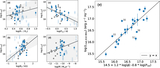
(a) Radio spectra of HD 37742. The 13, 3, and 1 cm observations from S. Kurapati et al. (2017) are shown in blue, while the 6 and 3.6 cm observations from H. J. G. L. M. Lamers & C. Leitherer (1993) are shown in green. The fit is performed by excluding the 610 MHz observation. The fitted spectral index is 0.74 ± 0.04. (b) Radio spectra of HD 200775. The 3.6, 6, and 20 cm observations taken from S. L. Skinner et al. (1993) are shown in blue, while the GMRT flux densities are shown in red. The fit is performed by excluding the nondetections at 20 cm. The fitted spectral index is 0.28 ± 0.06. (c) Radio spectra of HD 142184 combining data from different telescopes. GMRT observations from this work are represented by red circles, and the sub-GHz archival ASKAP observations are shown with a black star. See text for details on other data points. (d) Similar to the top panels, but for HD 175362. The spectral index is negative in this case.
Other Images in This Article
Show More
Copyright and Terms & Conditions
© 2026. The Author(s). Published by the American Astronomical Society.