Image Details
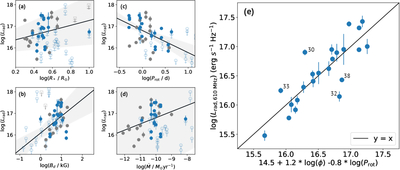
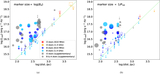
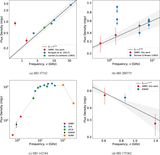
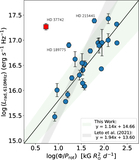
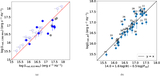
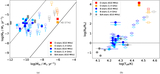
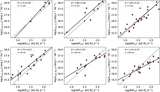
Caption: Figure 6.
(a)–(d) Variation of radio luminosity with selected stellar parameters, along with their best fits. The blue filled circles represent detected targets from this study, while the gray filled circles represent detected targets from other GMRT studies. The open circles/squares represent the nondetected B- and O-type stars, respectively. The black lines represent the best fit, and the shaded regions represent the uncertainty in the fits. HD 37742 was excluded from regression analysis and thus not shown in these plots. (e) Two-variable regression of magnetic flux (Φ) and rotation period vs. radio luminosity at 610 MHz. Some of the potential outliers are labeled according to their corresponding IDs.
Other Images in This Article
Show More
Copyright and Terms & Conditions
© 2026. The Author(s). Published by the American Astronomical Society.