Image Details
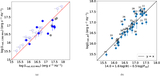
Caption: Figure 10.
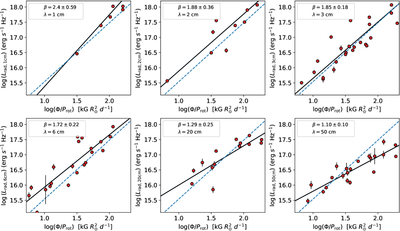
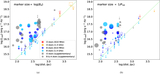
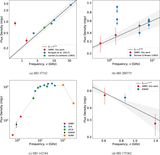
Similar to Figure 7, but for six different frequency bands separately. Both α and β from Equation (8) are kept as free parameters in all cases. The bounds for x- and y-axes are kept fixed for comparison. The 1, 2, 3, and 6 cm data were taken from M. E. Shultz et al. (2022). The remaining two datasets are from this study. The blue dashed line represents the best-fit line from P. Leto et al. (2021), and the black solid line is the best-fit line from this work.
Other Images in This Article
Show More
Copyright and Terms & Conditions
© 2026. The Author(s). Published by the American Astronomical Society.
Copyright ©
2026 Astronomy Image Explorer. All Rights Reserved.