Image Details
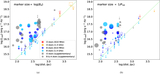
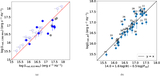
Caption: Figure 9.
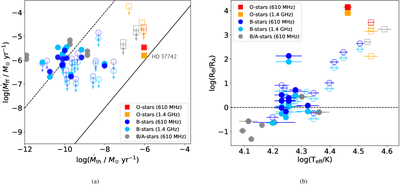
Free–free characteristics of the sample. (a) Comparison of theoretically predicted mass-loss rates (﹩\dot{{M}_{{\rm{th}}}}﹩) and mass-loss rate assuming a completely free–free thermal emission (﹩\dot{{M}_{{\rm{ff}}}}﹩). The black solid line represents ﹩\dot{{M}_{{\rm{th}}}}=\dot{{M}_{{\rm{ff}}}}﹩, while the dashed line represents ﹩\dot{{M}_{{\rm{ff}}}}=1{0}^{4}\dot{{M}_{{\rm{th}}}}﹩. (b) Variation of the ratio of free–free radius Rff and Alfvén radius RA with effective temperature. The black dashed horizontal line represents the Rff = RA boundary. For stars with Rff > RA, the effect of FFA is predicted to be significant. For both figures, the symbols are the same as in Figure 4, with uniform symbol size.
Other Images in This Article
Show More
Copyright and Terms & Conditions
© 2026. The Author(s). Published by the American Astronomical Society.